
Track your CloudFlare PoPs usage in Google Analytics
Notice: This article is more than 10 years old. It might be outdated.
Cloudflare provides a content delivery network and distributed domain name server services to help secure and accelerate websites. This cloud-based service sits between the visitor and the CloudFlare user’s hosting provider, acting as a reverse proxy for the website.
This article will help you visualize the global presence of your website, when using CloudFlare, with the well-known tool Google Analytics. You need to have your website running through CloudFlare for this to work.
Signing up with CloudFlare is easy and free and usually only takes 5 minutes.
About CloudFlare’s Points-of-Presence
CloudFlare currently uses 63 data centers worldwide as points-of-presence to deliver fast and secure website traffic (See Figure 1).
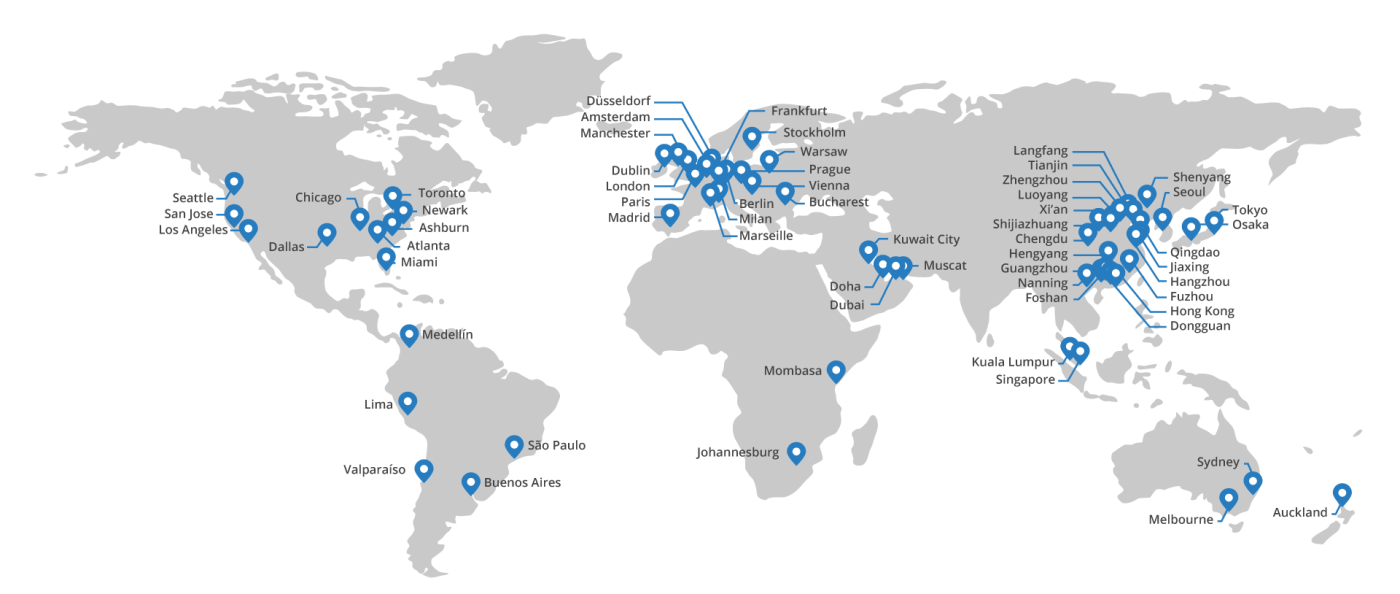
This means that as a CloudFlare customer your website is delivered to your audience from all these locations worldwide, reducing the network hops and lowering latency. As a result your website gains a global presence on an affordable budget, while improving performance.
Wouldn’t it be great to get insight into how much these worldwide locations help you with your website? In this post you will learn how to get started by gaining insight into which CloudFlare location delivers your website traffic.
Setup
Create a custom dimension in Google Analytics
First, set up a custom dimensions for the location of the CloudFlare PoP that serves a request in Google Analytics:
- Sign in to Google Analytics.
- Select the Admin tab and navigate to the property to which you want to add custom dimensions.
- In the Property column, click Custom Definitions, then click Custom Dimensions.
- Click New Custom Dimension.
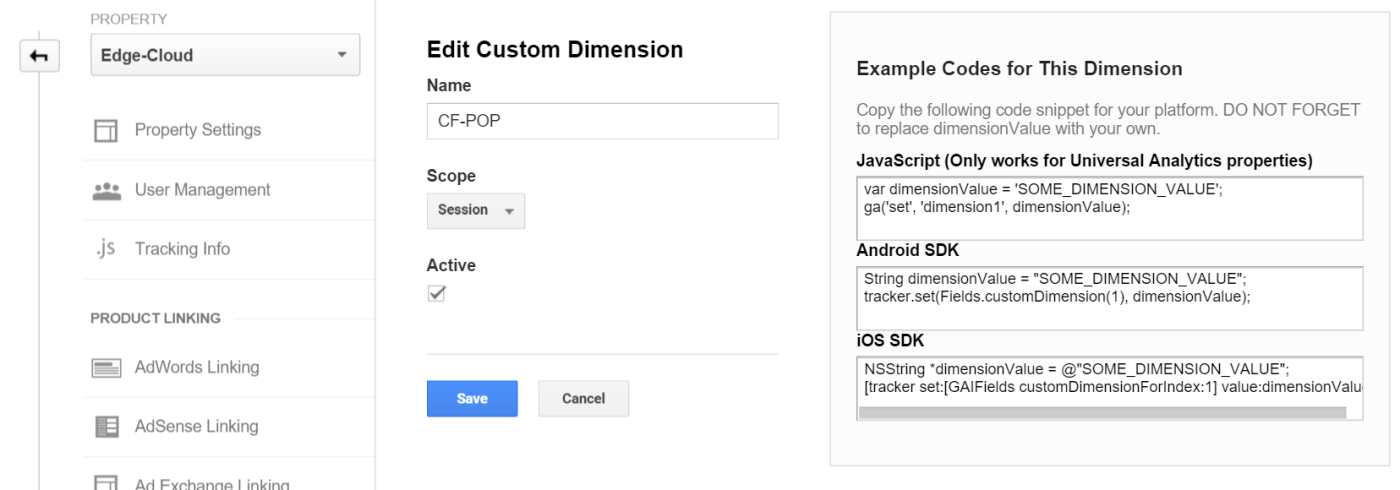
- Add a Name. This can be any string, but use something unique so it’s not confused with any other dimension or metric in your reports. Only you will see this name in the Google Analytics page.
- Select the Scope. Choose to track at the Hit, Session, User, or Product level. For this scenario I recommend to choose Hit or rather Session.
- Check the Active box to start collecting data and see the dimension in your reports right away. To create the dimension but have it remain inactive, uncheck the box.
- Click Create.
- Note down the dimension ID from the displayed example codes. In the example for this blog post the dimension ID is “1” (See Figure 2).
Embed the Google Analytics Tracking Code
Next we need to embed the Google Analytics tracking code within the website, in order to fill the newly created custom dimension with data. This tracking code has to be placed between the code for creating the Google Analytics tracker, which looks like this: __gaTracker('create','UA-12345678-1','auto');, and the code to submit the tracker, which looks like this __gaTracker('send','pageview');.
If you are using WordPress the easiest way to include the custom tracking code is by using the “Google Analytics by Yoast” plugin. This plugin allows you under Advanced > Custom Code to embed the below code right away and without any coding requirements.
But first we have to actually determine the CloudFlare PoP location that serves a request. For this we can use the HTTP response header “cf-ray”, which is added by CLoudFlare for troubleshooting purposes. It includes a numeric value, as well as the location code of the CloudFlare PoP.
The below JavaScript code will read the “cf-ray” response header, extract the location ID and push it into the Google Analytics custom dimension variable. Ensure that the numeric ID of this custom dimension variable matches what you have created in above steps.
function loc(){
  var req = new XMLHttpRequest();
  req.open('HEAD', document.location, false);
  req.send(null);
  return (req.getResponseHeader("cf-ray").split("-"))[1];
}
__gaTracker('set','dimension1',loc());</pre>
Embedded in your website along with the standard Google Analytics tracking code, this custom JavaScript code will determine the CloudFlare PoP over which the corresponding site was served and push it into Google Analytics.
A few hours after embedding the code you should see your first custom dimension data in Google Analytics.
Usage
Create a custom report in Google Analytics
You can now create custom reports with the custom dimension in Google Analytics. A simple example would be to determine which CloudFlare PoP serves how many of your audience’s session.
- Make sure you are still signed in to Google Analytics.
- Select the Customization tab and click on New Custom Report.
- Name your Custom Report here.
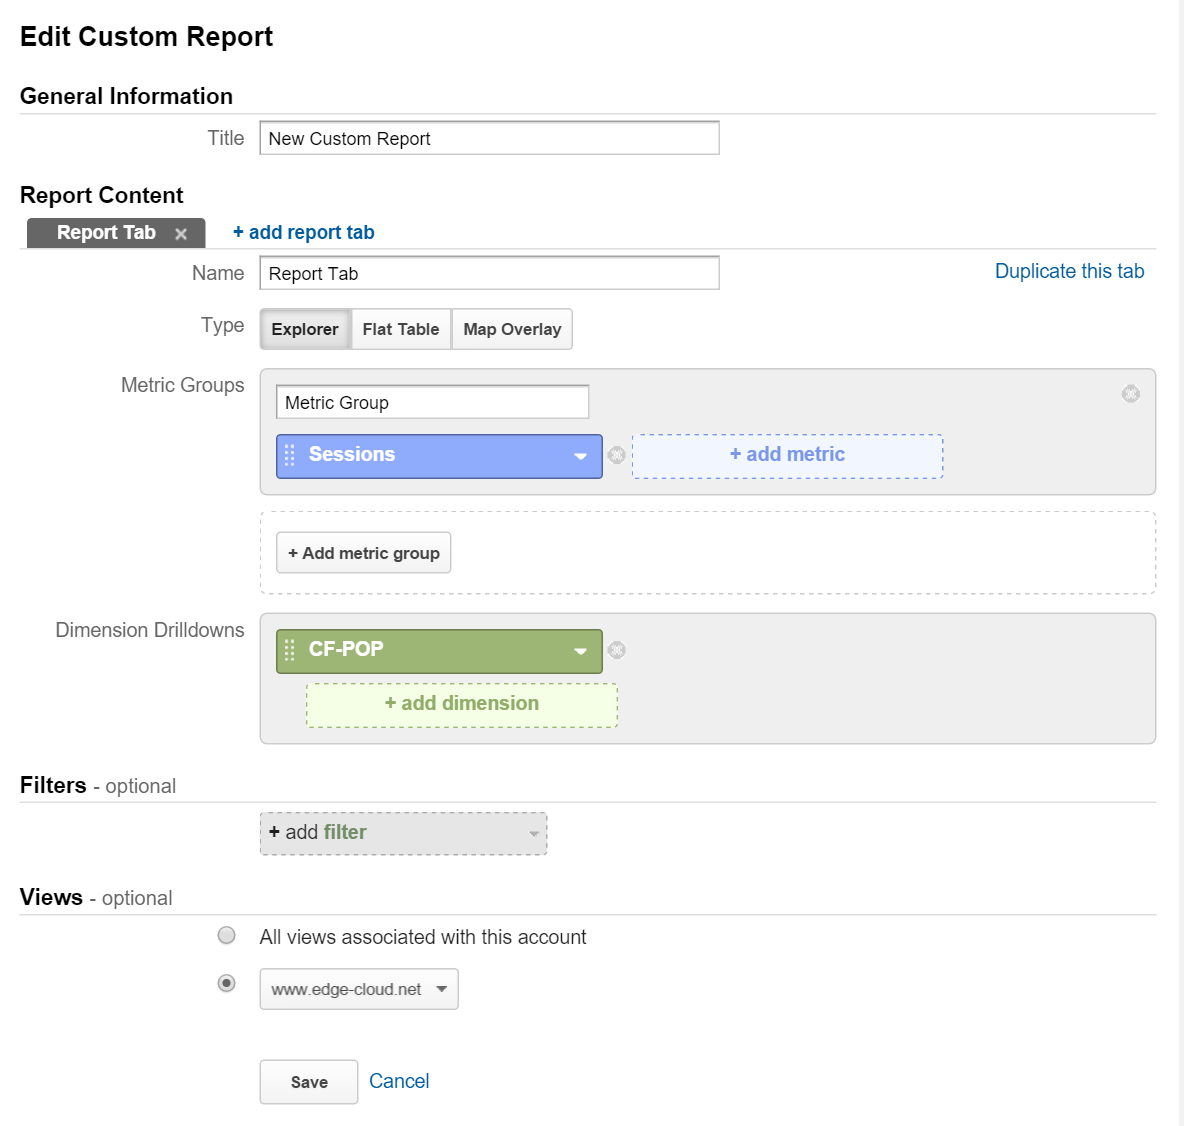
- Select a Metric for which you want to see your Custom Dimensions. I recommend the metric “Sessions” within the “Users” Metric Group.
- Next select the custom dimension that you created as the “Dimension Drilldown” (See Figure 3).
- Click on the Save button.
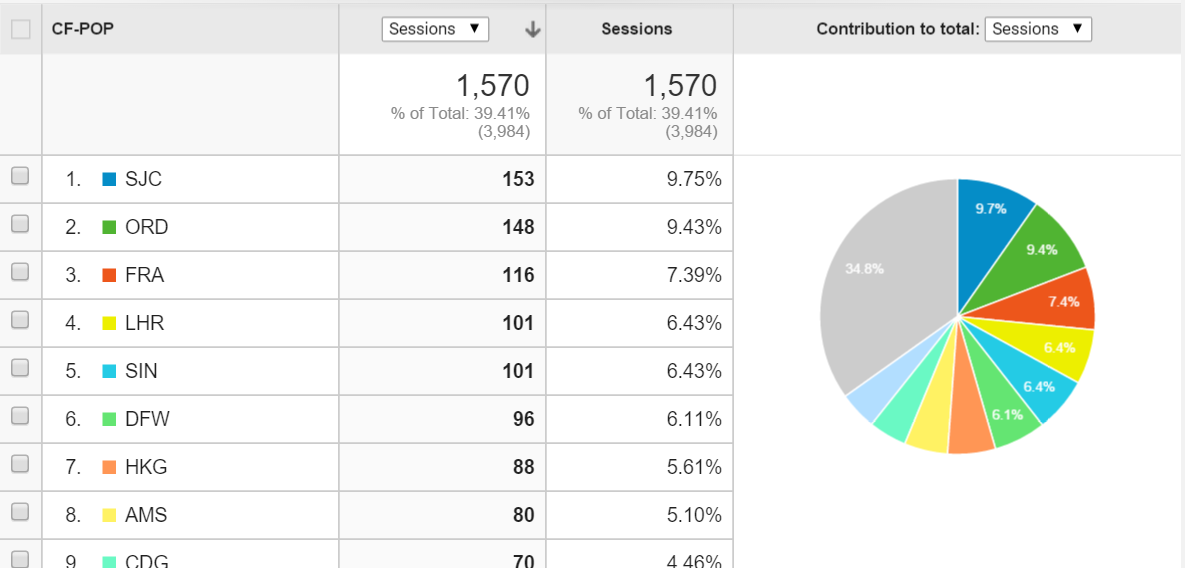
The resulting Custom Report will show you how many session - in total numbers, but also in percent - were served by which CloudFlare PoP. Using the “Percantage” button you can quickly generate a pie chart with the data (See Figure 4). In the example below you can see that the three most used CloudFlare PoPs for this site are San Jose, Chicago and Frankfurt (Germany).
Combining the new custom dimension with Google Analytics Data
Now that we have the CloudFlare Point-of-Presence that served a web site in Google Analytics, we can leverage this data for many more interesting reports.
One such report could be to map the location from where users connect to the CloudFlare PoPs. Figure 5 shows all 9 CloudFlare PoPs in the United States and the cities from which end-users connect to them, while accessing this blog.
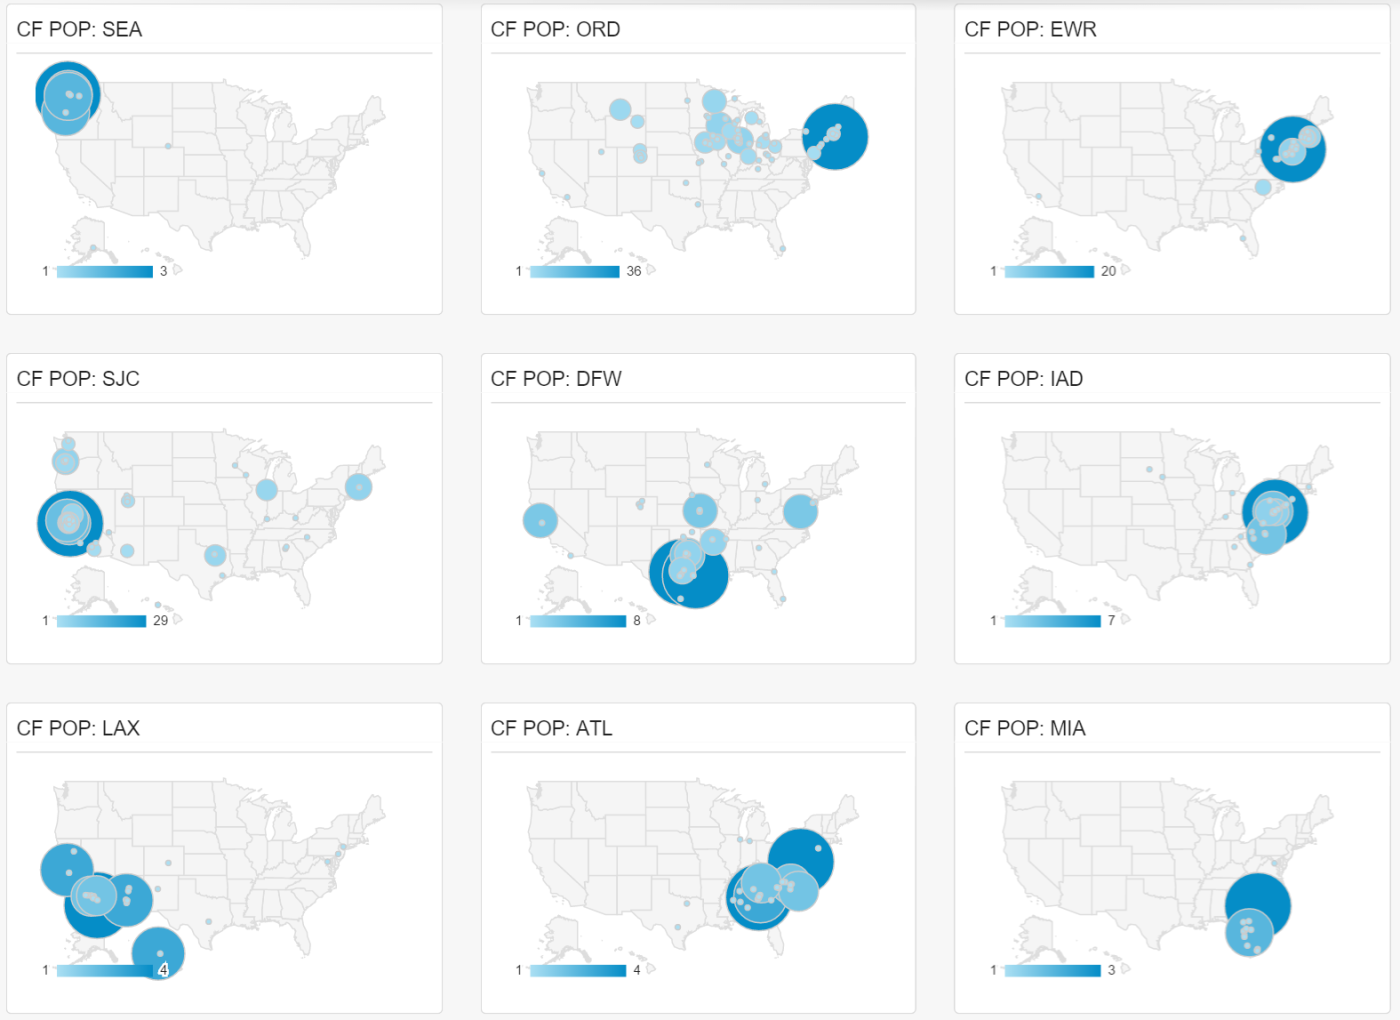
In this report we can see various users not being served by the closest Point of Presence, but one farther away. This is mostly caused by the way that the Internet works and especially by some
ISPs not peering directly with content or CDN networks. Instead these ISP use Tier 1 network provider, which can cause these inefficiencies.
Summary
Google Analytics Custom dimension provide a simple way to visualize the great benefits of the global presence of your website, thanks to CloudFlare. Leverage it to see the benefits to your website, while using CloudFlare.
Leave a comment