
Measuring Network Throughput
Notice: This article is more than 13 years old. It might be outdated.
The topic of measuring network throughput between network devices comes up quite frequently: It ranges from users claiming (and sometimes almost blaming) that the 100 Mbps Internet uplink in reality is only 10 Mbps to being surprised why they can’t transfer that multi-gigabyte file via FTP faster between data center locations.
Let’s have a look behind the scenes of network throughput measurement and understand why users are often actually measuring something completely different, but also how to get more “performance” out of these connections.
Sliding window protocols
Most user utilize software based on the Transmission Control Protocol (TCP) for measuring the network throughput. It is very important to keep in mind that TCP is a sliding window protocol.
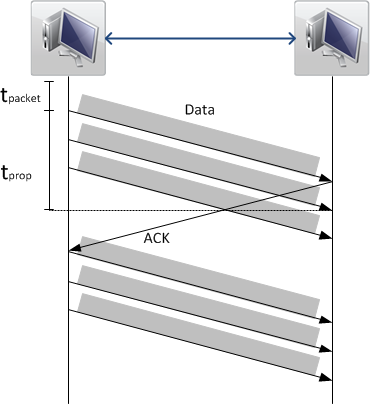
In order to guarantee reliable in-order delivery of packets, only a “window” of packets may be send without the receiver acknowledging them (See Figure 1). The size of this “window” is governed by the receiver and is referred to as the TCP Window Size. This way the receiver ensures that it can actually process the incoming data without “choking” on it.
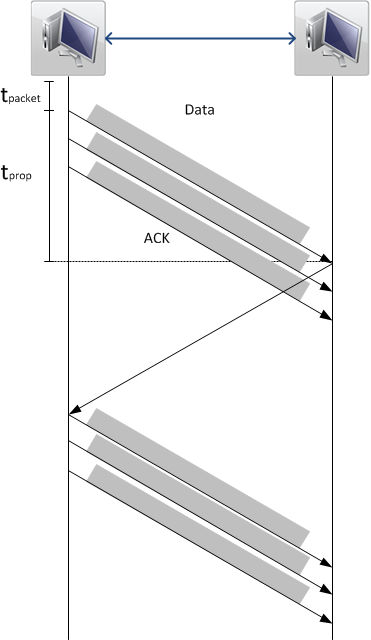
Looking at Figure 1 it should become clear that while increasing the value of the signal propagation time tprop, the amount of data that can be transferred in the same time period is reduced. This is caused by the sender spending more time waiting for acknowledgements, before it will send further packages. (See Figure 2)
The propagation time tprop for a TCP packet can be determined by measuring the round-trip-time (RTT) of a packet. Here the round-trip-time is twice the propagation time for synchronous links. This can e.g. be done via the well known tool ping. The TCP window size is determined by the operating system. During a connection the receiver can also adapt the TCP Window Size - in both directions - if the situation changes due to packet loss or buffer fill levels.
Bandwidth-delay Product and buffer size
Now that we have identified the two most important variables for the performance of TCP based data transfers, let’s look at the math behind the sliding window concept:
An important formula is the one for the Bandwidth-delay product (BDP), which is the product of a data link’s capacity (in bits per second) and its end-to-end delay (in seconds). The result, an amount of data measured in bits (or bytes), is equivalent to the maximum amount of data on the network circuit at any given time, e.g. data that has been transmitted but not yet acknowledged.
\[Buffer (Mbit) = bandwidth (Mbit/s) × delay (s)\]The result of the BDP can also be interpreted as the required receiver TCP window size to maximize the performance on the data link.
Let’s use an example:
Round-Trip-Time between the US west coast (Las Vegas) and Europe (Germany): 173 ms Available bandwidth between the two sites: 100 Mbit/s
\[173 ms × 100 Mbit/s = 0.173s × ( 100 × 1024 × 1024 bit/s) \\ = 18140365 bit = 2.1625 MByte\]This means that we would need a TCP Window Size of at least 2.1625 MByte to fully utilize the 100 Mbit/s link.
We have seen, that in reality both the delay between sender and receiver as well as the TCP window size within the receiver are given. As we cannot change the laws of physics, the only value we can change is the TCP window size. Let’s shuffle the formula, to calculate the maximum bandwidth that can be achieved with a given RTT and TCP window size instead:
\[bandwidth (Mbit/s) = { Buffer (Mbit) \over delay (s) }\]Let’s use another example:
Round-Trip-Time between the US west coast (Las Vegas) and Europe (Germany): 173 ms Standard TCP windows size on a Linux (Ubuntu) host: 64 KByte
\[{ 64 KByte \over 173 ms } = { (64 × 1024 × 8 bit) \over 0.173 s } = { 524288 bit \over 0.173s } \\ = 3030566.47 bit/s = 2.89 Mbit/s\]Irrelevant of the actual link speed between the two sites above we will not be able to transfer more than 2.89 Mbit/s with a single TCP stream. Keep in mind that this is the theoretical maximum. In reality the value will be even lower due to packet loss and packet header overhead.
If you get tired of performing the math manually, have a look at the TCP throughput calculator from switch.ch.
Limit of TCP Windows field in the protocol header
The TCP window size field within the TCP header is 16 bit and therefore cannot be expanded beyond 64K. How is it then possible to specify a TCP window size higher than 64K? That’s where RFC 1323 defines a scaling factor, which allows scaling up to larger window sizes and thereby enables TCP tuning. This method increases the maximum window size from 65,535 bytes to 1 gigabyte.
The window scale option is used only during the TCP 3-way handshake at the beginning of the connection. The window scale value represents the number of bits to left-shift the 16-bit window size field. The window scale value can be set from 0 (no shift) to 14 for each direction independently. Both sides must send the option in their SYN segments to enable window scaling in either direction.
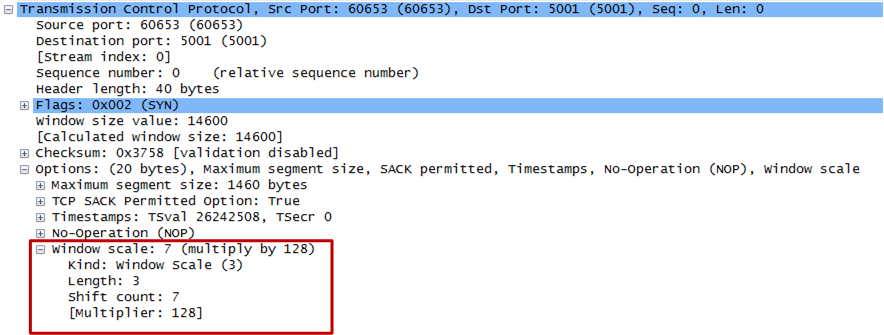
Here is a problem: Some routers and packet firewalls rewrite the window scaling factor during a transmission, which will cause sending and receiving sides to assume different TCP window sizes. The result is non-stable traffic that may be very slow. One can use packet sniffers such as Wireshark to ensure that the TCP scaling factor are negotiated correctly on sender and receiver side. Figure 3 shows an example of this in Wireshark.
Hands-On Tests
Now it’s time to verify above’s theory in practice: For this we will use the tool Iperf, which is widely available on Linux. On Ubuntu you can e.g. install Iperf with sudo apt-get install iperf.
In this case the sender host is an Ubuntu machine located in a data center in Frankfurt, Germany and the receiver host is an Ubuntu machine located in a data center in Las Vegas, USA. The latency between the two machines is 173 ms with both machines being connected via an 100 Mbit/s uplink to the internet.
On the receiver host we will start iperf as a server and advice it to use the standard TCP window size of 64K:
user@receiver:~$ iperf -s -w 65536
From the sender side we start the test:
user@sender:~$ iperf -c receiver.edge-cloud.net
------------------------------------------------------------
Client connecting to receiver.edge-cloud.net, TCP port 5001
TCP window size: 64 KByte (default)
------------------------------------------------------------
[  3] local 1.2.3.4 port 48448 connected with 5.6.7.8 port 5001
[ ID] Interval       Transfer     Bandwidth
[  3]  0.0-10.6 sec  3.50 MBytes  2.77 Mbits/sec
The result is what we would expect from the theory and math in the previous section. It also shows nicely that the result is well below the 100 Mbit/s of the Internet links.
Let’s try to increase the TCP Window size on the receiver and run the test again. As Iperf is a user process it cannot actually increase the TCP Window size beyond what’s set in the Kernel. We therefore have to make these changes directly in the Kernel. As a first step it’s advisable to have a look at the current TCP Window settings on the receiver and make note of them, so that they can be restored.
The way the TCP Window works is that sender and receiver negotiate an optimal window size based on various factors. Therefore Linux has two values for the TCP Window. The default value, which is the starting window size and the max value, which is the upper bound of it:
The maximum TCP windows size (receiving) in bit from the TCP autotuning settings:
user@receiver:~$ cat /proc/sys/net/ipv4/tcp_rmem
4096    65536   65536
The first value tells the kernel the minimum receive buffer for each TCP connection, and this buffer is always allocated to a TCP socket, even under high pressure on the system.
The second value specified tells the kernel the default receive buffer allocated for each TCP socket. This value overrides the /proc/sys/net/core/rmem_default value used by other protocols.
The third and last value specified in this variable specifies the maximum receive buffer that can be allocated for a TCP socket. We want to manipulate this third value on the receiver side.
The maximum TCP windows size (sending) in bit from the TCP autotuning settings:
user@sender:~$ cat /proc/sys/net/ipv4/tcp_wmem
4096    65536   65536
This variable takes 3 different values which holds information on how much TCP sendbuffer memory space each TCP socket has to use. Every TCP socket has this much buffer space to use before the buffer is filled up. Each of the three values are used under different conditions. The first value in this variable tells the minimum TCP send buffer space available for a single TCP socket. The second value in the variable tells us the default buffer space allowed for a single TCP socket to use. The third value tells the kernel the maximum TCP send buffer space. Again we want to manipulate the third value. This time on the sender side
Let’s double the TCP Window size, thus reaching 128K. Using the TCP throughput calculator from switch.ch, we should expect a maximum TCP throughput of 5.92 Mbit/sec with these settings:
First, change the maximum TCP windows size (receiving) on the receiver:
user@receiver:~$ sysctl -w net.ipv4.tcp_rmem="4096 65536 131072"
net.ipv4.tcp_wmem = 4096 65536 131072
user@receiver:~$ sysctl -w net.core.rmem_max=131072
net.core.rmem_max = 131072
Next, change the default TCP windows size (sending) on the sender:
user@sender:~$ sysctl -w net.ipv4.tcp_wmem="4096 65536 131072"
net.ipv4.tcp_wmem = 4096 65536 131072
user@sender:~$ sysctl -w net.core.wmem_max=131072
net.core.rmem_max = 131072
On the receiver host we will start iperf as a server and advice it to use the TCP window size of 128K:
user@receiver:~$ iperf -s -w 131072
Now we run the test again:
user@sender:~$ iperf -c receiver.edge-cloud.net -w 131072
------------------------------------------------------------
Client connecting to receiver.edge-cloud.net, TCP port 5001
TCP window size:  256 KByte (WARNING: requested  128 KByte)
------------------------------------------------------------
[  3] local 1.2.3.4 port 48448 connected with 5.6.7.8 port 5001
[ ID] Interval       Transfer     Bandwidth
[  3]  0.0-10.2 sec  6.50 MBytes  5.35 Mbits/sec
Again, the result is what we would expect from the theory and math in the previous section.
Be advised that there is a limit to this approach: If you keep doubling the TCP window size, you will at one point reach the buffer limits of your OS and therefore not experience any additional performance gains anymore.
Real “bandwidth” tests
Warning! You should perform “bandwidth” tests of your links only when they are not in use. Otherwise your results will not be meaningful. Also, while I show you how to use UDP to determine the bandwidth of a link, this protocol does not bring any form of congestion control. While this is a good thing for measuring the bandwidth on an un-utilized link, you will starve out other traffic on a utilized link. You will basically cause a denial of service attack on the link. Therefore proceed with uttermost care!
So far we have learned that the throughput of a single TCP is limited by the TCP window size and the RTT. But what happens if I use multiple TCP streams in parallel? Looking at how TCP works, each of these TCP streams should be able to create an individual maximum throughput as determined in the previous section. Furthermore they should share the available bandwidth fairly with each other until nothing is left.
Let’s see if this is really the case:
On the receiver host we again start Iperf as a server and advice it to use the TCP window size of 128K:
user@receiver:~$ iperf -s -w 131072
But on the server side we will advise Iperf to start 10 parallel test:
user@sender:~$ iperf -c receiver.edge-cloud.net -P 10 -w 131072
------------------------------------------------------------
Client connecting to receiver.edge-cloud.net, TCP port 5001
TCP window size:  256 KByte (WARNING: requested  128 KByte)
------------------------------------------------------------
[  4] local 1.2.3.4 port 48524 connected with 4.3.2.1 port 5001
[  6] local 1.2.3.4 port 48526 connected with 4.3.2.1 port 5001
[  5] local 1.2.3.4 port 48525 connected with 4.3.2.1 port 5001
[  8] local 1.2.3.4 port 48527 connected with 4.3.2.1 port 5001
[  7] local 1.2.3.4 port 48529 connected with 4.3.2.1 port 5001
[  9] local 1.2.3.4 port 48528 connected with 4.3.2.1 port 5001
[ 11] local 1.2.3.4 port 48531 connected with 4.3.2.1 port 5001
[ 10] local 1.2.3.4 port 48530 connected with 4.3.2.1 port 5001
[  3] local 1.2.3.4 port 48523 connected with 4.3.2.1 port 5001
[ 12] local 1.2.3.4 port 48532 connected with 4.3.2.1 port 5001
[ ID] Interval       Transfer     Bandwidth
[  5]  0.0-10.0 sec  5.62 MBytes  4.70 Mbits/sec
[  8]  0.0-10.2 sec  5.75 MBytes  4.73 Mbits/sec
[  7]  0.0-10.2 sec  5.75 MBytes  4.73 Mbits/sec
[  6]  0.0-10.2 sec  6.00 MBytes  4.93 Mbits/sec
[ 12]  0.0-10.2 sec  5.75 MBytes  4.72 Mbits/sec
[ 11]  0.0-10.2 sec  5.88 MBytes  4.81 Mbits/sec
[  4]  0.0-10.3 sec  6.12 MBytes  4.99 Mbits/sec
[  3]  0.0-10.3 sec  6.12 MBytes  4.98 Mbits/sec
[  9]  0.0-10.3 sec  5.88 MBytes  4.76 Mbits/sec
[ 10]  0.0-10.3 sec  6.00 MBytes  4.87 Mbits/sec
[SUM]  0.0-10.3 sec  58.9 MBytes  47.8 Mbits/sec
We now see that the throughput result of 47.8 Mbit/s is almost 10x of the throughput of an individual test. Keep in mind additional overhead that this test has to deal with.
Again, be advised that there is a limit to this approach: While you can keep increasing the number of parallel tests, there is a limit on how many parallel TCP streams your host can handle. At one point you will therefore not see a performance improvement anymore.
Time to bring out the big guns: UDP
So far we have only been able to verify that we can transfer with rates of about 47.8 Mbit/s between sender and receiver in our example. While this is already a huge increase to the 2.77 Mbit/s that we measured originally, it still falls short of the 100 Mbit/s that we should be getting.
Let’s change our so far strategy and switch over to a protocol that does not suffer from the limitations of a sliding window protocol: UDP to the rescue. UDP does not utilize a feedback channel to notice network congestion or receiver buffer exhaustion. It is a “fire and forget” protocol. That makes it very dangerous for sending data at a sustained high data rate, which data transfer would bring to the table. It will basically overrun any other TCP traffic and completely utilize any available bandwidth. Bottom line: Used on a shared link the following approach will equal to a denial of service attack. Therefore do not use it on a shared link, especially if it is carrying production traffic.
On the receiver host we again start Iperf as a server. But this time we start it in UDP mode:
user@receiver:~$ iperf -s -u
On the sender side we also start Iperf in UDP mode and ask it to attempt to sent 110 Mbit/s of traffic. We will attempt to send a bit more than the expected maximum bandwidth, to understand when the links max out:
user@sender:~$ iperf -c receiver.edge-cloud.net -u -b 110m
------------------------------------------------------------
Client connecting to receiver.edge-cloud.net, TCP port 5001
Sending 1470 byte datagrams
UDP buffer size:  224 KByte (default)
------------------------------------------------------------
[  3] local 1.2.3.4 port 43816 connected with 5.6.7.8 port 5001
[ ID] Interval       Transfer     Bandwidth
[  3]  0.0-10.0 sec   132 MBytes   110 Mbits/sec
[  3] Sent 93963 datagrams
[  3] Server Report:
[  3]  0.0-10.0 sec   117 MBytes  98.0 Mbits/sec   0.124 ms 10515/93962 (11%)
[  3]  0.0-10.0 sec  114 datagrams received out-of-order
The results show that we can transfer 98.0 Mbit/s with UDP between sender and receiver host, which is close to the expected maximum of 100 Mbit/s. Again, you have to factor in protocol overhead why you will not achieve the full 100 Mbit/s throughput.
Now let’s see what would happen to a TCP transfer between the same hosts running at the same time.
For this we need to open two Terminal or SSH connections to the sender at the same time.
On the receiver host we start one instance of Iperf as a UDP server and one instance as a TCP server with TCP window size of 128K. They will both spawn to the background.
user@receiver:~$ iperf -s -u &
user@receiver:~$ iperf -s -w 131072 &
Don’t forget to kill these processes once you are done!
On the sender side we will start two tests at exactly the same time. One test with Iperf in TCP mode. And another test with Iperf in UDP mode, again asking it to attempt to sent 110 Mbit/s of traffic. To showcase better the effect of UDP traffic flooding a link we will ask Iperf to run 10 UDP test in parallel. Make sure to start both tests at the same time:
UDP Test
user@sender:~$ iperf -c receiver.edge-cloud.net -u -b 110m -P 10
------------------------------------------------------------
Client connecting to las-mgmt-ubu01.vmwcs.com, UDP port 5001
Sending 1470 byte datagrams
UDP buffer size:  224 KByte (default)
------------------------------------------------------------
[  4] local 1.2.3.4 port 48228 connected with 5.6.7.8 port 5001
[  5] local 1.2.3.4 port 58444 connected with 5.6.7.8 port 5001
[  7] local 1.2.3.4 port 56308 connected with 5.6.7.8 port 5001
[  6] local 1.2.3.4 port 34767 connected with 5.6.7.8 port 5001
[  8] local 1.2.3.4 port 32790 connected with 5.6.7.8 port 5001
[  9] local 1.2.3.4 port 47212 connected with 5.6.7.8 port 5001
[ 10] local 1.2.3.4 port 46375 connected with 5.6.7.8 port 5001
[  3] local 1.2.3.4 port 51226 connected with 5.6.7.8 port 5001
[ 11] local 1.2.3.4 port 40858 connected with 5.6.7.8 port 5001
[ 12] local 1.2.3.4 port 51633 connected with 5.6.7.8 port 5001
[ ID] Interval       Transfer     Bandwidth
[  4]  0.0-10.0 sec  34.9 MBytes  29.3 Mbits/sec
[  4] Sent 24875 datagrams
[  5]  0.0-10.0 sec  34.8 MBytes  29.2 Mbits/sec
[  5] Sent 24814 datagrams
[  7]  0.0-10.0 sec  34.5 MBytes  28.9 Mbits/sec
[  7] Sent 24601 datagrams
[  6]  0.0-10.0 sec  34.9 MBytes  29.3 Mbits/sec
[  6] Sent 24878 datagrams
[  8]  0.0-10.0 sec  34.6 MBytes  29.1 Mbits/sec
[  8] Sent 24704 datagrams
[  9]  0.0-10.0 sec  34.9 MBytes  29.3 Mbits/sec
[  9] Sent 24882 datagrams
[ 10]  0.0-10.0 sec  34.5 MBytes  29.0 Mbits/sec
[ 10] Sent 24634 datagrams
[  3]  0.0-10.0 sec  35.1 MBytes  29.4 Mbits/sec
[  3] Sent 25015 datagrams
[ 11]  0.0-10.0 sec  34.8 MBytes  29.2 Mbits/sec
[ 11] Sent 24805 datagrams
[ 12]  0.0-10.0 sec  34.5 MBytes  28.9 Mbits/sec
[ 12] Sent 24581 datagrams
[SUM]  0.0-10.0 sec   347 MBytes   291 Mbits/sec
[  3] Server Report:
[  3]  0.0-10.0 sec  12.1 MBytes  10.1 Mbits/sec   2.309 ms 16396/25014 (66%)
[  3]  0.0-10.0 sec  14 datagrams received out-of-order
[  8] Server Report:
[  8]  0.0-10.0 sec  12.1 MBytes  10.1 Mbits/sec   2.273 ms 16104/24703 (65%)
[  8]  0.0-10.0 sec  1 datagrams received out-of-order
[  5] Server Report:
[  5]  0.0-10.0 sec  12.2 MBytes  10.2 Mbits/sec   1.844 ms 16117/24813 (65%)
[  5]  0.0-10.0 sec  1 datagrams received out-of-order
[  6] Server Report:
[  6]  0.0-10.0 sec  12.1 MBytes  10.2 Mbits/sec   1.737 ms 16217/24877 (65%)
[  6]  0.0-10.0 sec  1 datagrams received out-of-order
[  7] Server Report:
[  7]  0.0-10.0 sec  12.1 MBytes  10.1 Mbits/sec   1.883 ms 16003/24600 (65%)
[  7]  0.0-10.0 sec  1 datagrams received out-of-order
[ 11] Server Report:
[ 11]  0.0-10.0 sec  9.14 MBytes  7.66 Mbits/sec   1.618 ms 18283/24804 (74%)
[  4] Server Report:
[  4]  0.0-10.2 sec  12.1 MBytes  9.88 Mbits/sec  15.864 ms 16255/24863 (65%)
[  4]  0.0-10.2 sec  1 datagrams received out-of-order
[  9] Server Report:
[  9]  0.0-10.3 sec  9.17 MBytes  7.50 Mbits/sec  16.409 ms 18339/24881 (74%)
[  9]  0.0-10.3 sec  1 datagrams received out-of-order
[ 12] Server Report:
[ 12]  0.0-10.3 sec  12.0 MBytes  9.83 Mbits/sec  15.975 ms 16005/24575 (65%)
[ 12]  0.0-10.3 sec  1 datagrams received out-of-order
[ 10] Server Report:
[ 10]  0.0-10.3 sec  12.1 MBytes  9.87 Mbits/sec  16.419 ms 16022/24632 (65%)
[ 10]  0.0-10.3 sec  1 datagrams received out-of-order
Adding together the throughput of the 10 UDP connections we get a total throughput of 76.331 Mbit/s.
TCP Test
user@sender:~$ iperf -c las-mgmt-ubu01.vmwcs.com
------------------------------------------------------------
Client connecting to las-mgmt-ubu01.vmwcs.com, TCP port 5001
TCP window size: 23.5 KByte (default)
------------------------------------------------------------
[  3] local 78.47.152.89 port 48587 connected with 64.79.130.189 port 5001
[ ID] Interval       Transfer     Bandwidth
[  3]  0.0-10.6 sec  2.12 MBytes  1.68 Mbits/sec
On the other hand we see that these UDP connections starved our TCP connection from previously 5.35 Mbits/sec down to 1.68 Mbits/sec.
Finally we have been able to confirm that our available bandwidth between sender and receiver is indeed 100 Mbit/s. Yet at the same time we have seen how dangerous UDP can be on a link. Many enterprises therefore apply rate limiting to UDP on their WAN links or block it altogether.
It should also become clear that using a pure UDP based data transfer protocol on a shared link is a really bad idea.
Solutions to improve throughput
We have seen that increasing the TCP Window Size on the receiver side helps increasing the throughput that is possible with a single TCP stream. Unfortunately it is not possible to tweak this TCP Window Size on all Receivers for the encountered latency for all downloads. That is especially the case as increasing the TCP Window Size also brings drawbacks.
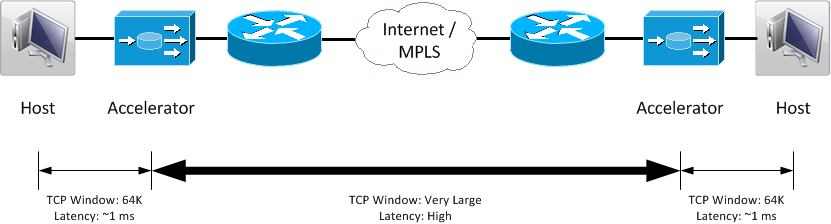
WAN Optimization Controller
Instead network architects usually deploy a pair of specialized devices - called WAN Optimization Controller (WOC) within the network stream. Placed as close as possible to server and client of the stream they act like a proxy in front of the actual server. While these WOC devices also utilize other improvement capabilities, one of their main capabilities is using an optimized transport mechanism with an increased TCP Window size between the.
One vendor offering such devices is Silver Peak, which offers An interesting tool with its Throughput Calculator from Silver Peak. Similar to the tool from Switch.ch, it will show you the maximum transfer speed that is possible with a given RTT and packet loss rate, while assuming a default TCP window size of 64K. in addition it will also show you the throughput that would be possible over the same link using a Silver Peak WOC pair.
Content Distribution Networks (CDN)
While we can indeed not change the laws of physics to decrease the RTT in our equation, one could use other methods to decrease the RTT. One such method would be the usage of Content Distribution Network (CDN) to place the server from which a user wants to download a file closer to this user, thus reducing the RTT.
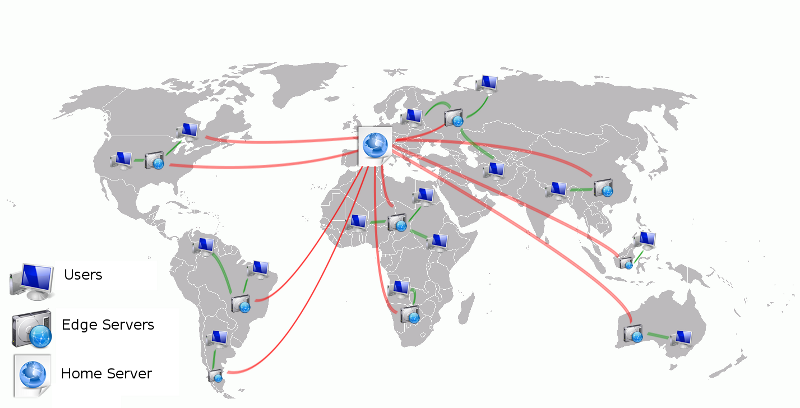
Instead of requesting a file from e.g Los Angeles while being in Munich, Germany, the file could be requested from a CDN node in Frankfurt, Germany. This would reduce the RTT from e.g. ~170 ms to ~4 ms. This is often used by companies and organizations to deliver large software downloads. One such example is VMware’s software download site using Akamai’s CDN.
UDP-based file transfer
Last but not least I would like to point out that there are in fact UDP based file transfer solutions out there, such as the one from Asperasoft. They overcome the “dangers” of UDP with smartly using a TCP channel for congestion control. Yet at the same time the transfer limit of this pure protocol is bound by the actual link bandwidth. WOC on the other hand usually utilize additional optimization techniques beside TCP window adjustment, giving you effective throughput higher than the maximum link bandwidth. See the previously mentioned Silver Peak calculator for examples.
Leave a comment